Trend Analyser
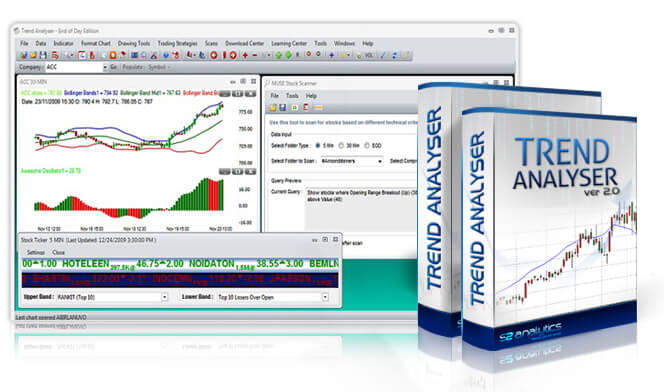
Trend Analyser is a professional charting and analysis software that comes with state-of-the-art tools to determine trend, momentum, buy and sell points for stocks.
Trend Analyser is a professional charting and analysis software that comes with state-of-the-art tools to determine trend, momentum, buy and sell points for stocks.
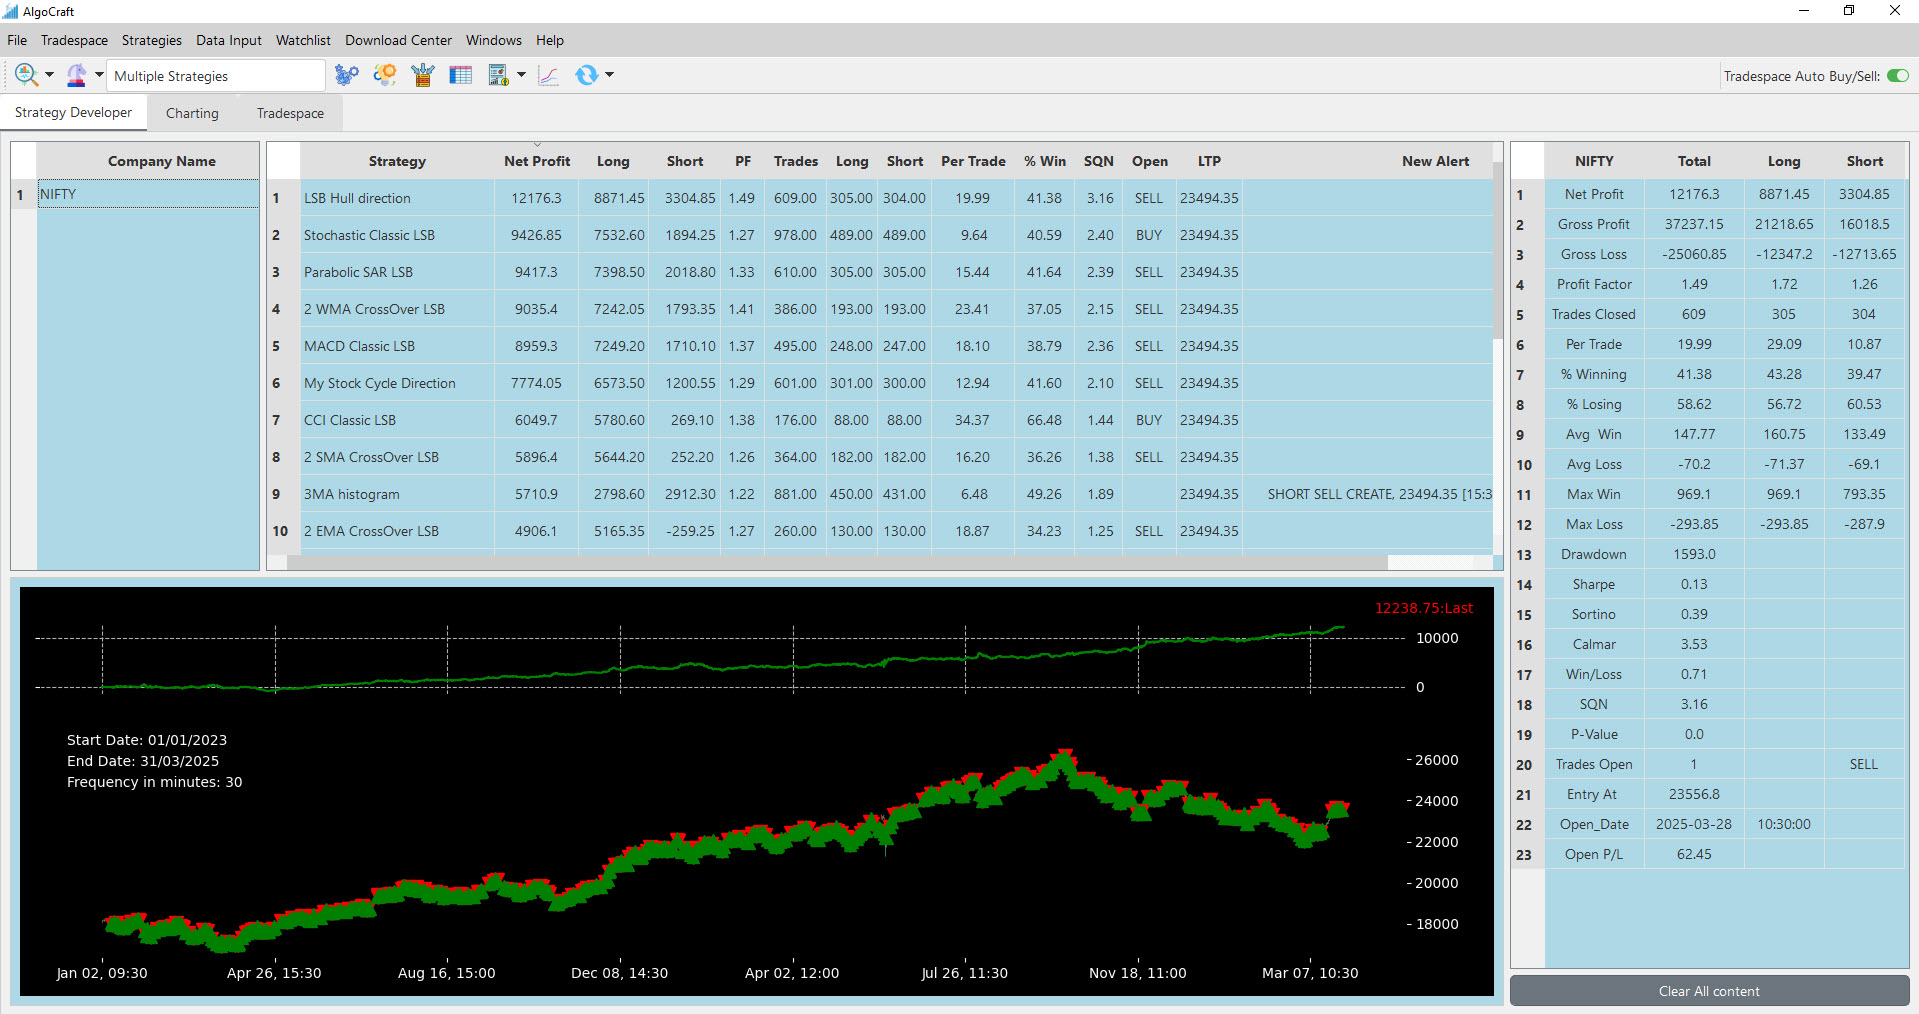
AlgoCraft empowers users to effortlessly scan and algo trade companies using built-in strategies
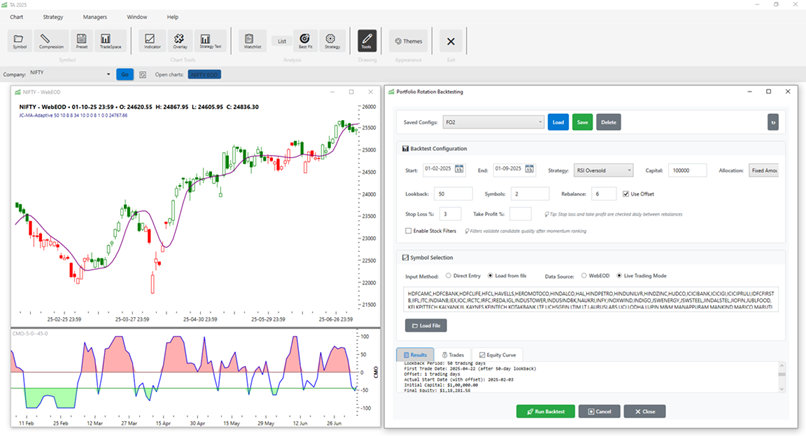
TA2025 is the next generation charting and analysis software. It is full of cutting edge tools such as enhanced charting, portfolio manager, back-testing engine, walk forward optimization and smart ma
Trend Analyser is a professional charting and analysis software that comes with state-of-the-art tools to determine trend, momentum, buy and sell points for stocks.
AlgoCraft empowers users to effortlessly scan and algo trade companies using built-in strategies
TA2025 is the next generation charting and analysis software. It is full of cutting edge tools such as enhanced charting, portfolio manager, back-testing engine, walk forward optimization and smart ma
The product is developed for today's markets which are volatile and tricky at times. Scroll below to see a list of features.
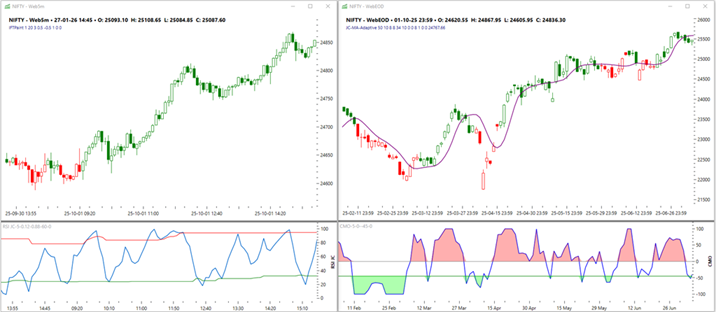
• Multiple Chart Types: Candlestick, OHLC, Renko, Kagi, Range Bar, Line
• Drawing Tools: Trend lines, Fibonacci, Channels, Support/Resistance
• Multi-Window Support: Multiple charts with different symbols/timeframes
• Customizable Themes: Light and dark themes with custom colors
• Chart Presets: Save and load favorite configurations instantly
• Smooth Zooming: Pan and zoom through years of data instantly
• Trend: Moving Averages (SMA, EMA, KAMA), SuperTrend, Ichimoku, ADX
• Momentum: RSI, MACD, Stochastic, CCI, CMO, Williams %R, ROC
• Volatility: Bollinger Bands, ATR, Keltner Channels, Normalized ATR
• Proprietary: Adaptive RSI, Zero Lag Filters, Schaff Trend, IFT
• Multi-Timeframe: 5min, 30min, Daily, Weekly, Monthly analysis
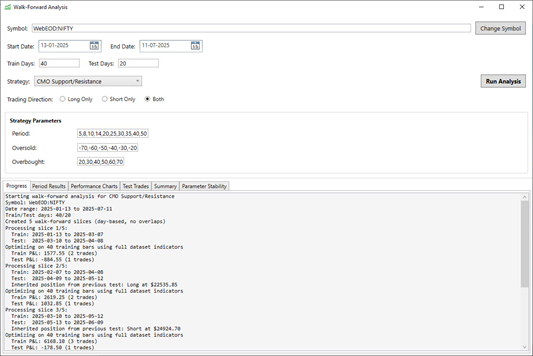
• In-Sample / Out-of-Sample Testing: Validate on unseen data
• Rolling Window Analysis: Re-optimize as markets change
• Bar-Based WFO: Universal timeframe support, ideal for intraday
• Date-Based WFO: Modular indicator rule system with daily optimization
• Robustness Metrics: Compare IS vs OOS performance
• Anchored vs Rolling Modes: Fixed-start or sliding windows
• Performance Degradation Analysis: Detect failing strategies
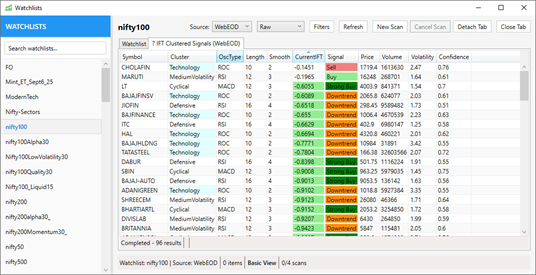
• Indicator-Based Scans: Run any indicator across entire watch-list
• Technical Filters: Filter by indicators, price action, volume
• ORB Scanner: Find stocks breaking out of morning range
• Multi-Window Analysis: Analyze across different lookback periods
• Clustered IFT Scan: Advanced Inverse Fisher Transform scanning
• Concurrent Processing: Parallel scanning for maximum speed
• Custom Watchlists: Scan your own symbol lists
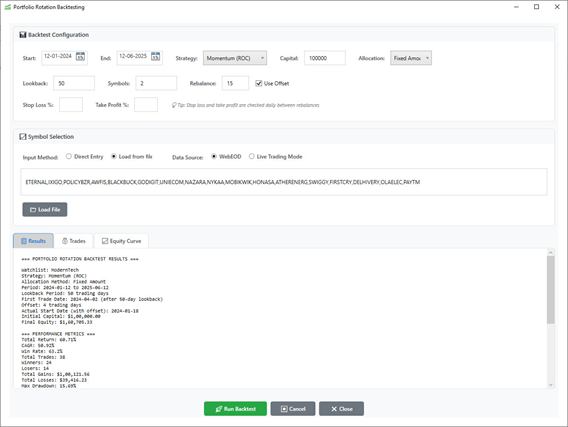
• Momentum-Based Rotation: ROC-based stock selection
• RSI Strategies: Rotate into oversold, exit overbought
• Market Regime Detection: HMM-based regime filtering
• Multi-Symbol Backtesting: Test across entire watchlists
• Position Sizing: Equal weight or custom allocation
• Configurable: Lookback, holdings count, rebalance frequency
• Performance Attribution: Understand return contributors
• Grid Search: Test thousands of parameter combinations
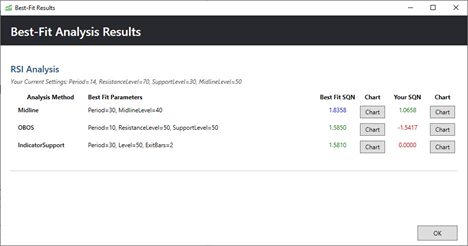
• Multiple Rules: ZeroCross, OBOS, Indicator Support trading
• SQN Metric: Van Tharp's System Quality Number
• Compare Settings: See current vs optimal parameters
• Interactive Charts: Visualize trades from optimized params
• One-Click Analysis: Select indicator, click Best Fit and see results
 Pay
Pay Sign Up